Manipulating the Map View
|
The result of a Flood Analysis is displayed in the map as visualized flood data. The flood visualization as well as the underlying map can be manipulated in a variety of ways.
|
|
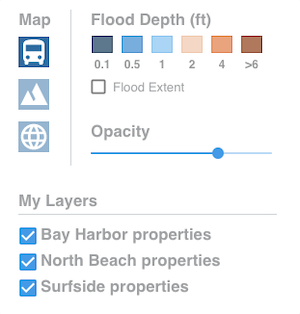
Change base mapBy default the map is a street level map. If desired, the street map can be switched to a satellite view that allows a more detailed view of buildings and facilities for instance. The map can also switched to topographic view that shows terrain details. To change the base map, hover the mouse over the Map Control in the upper right of the map. The Map Control expands automatically, select the desired base map: Street, Satellite or Topographic. Disable flood levelsIn some circumstances it may be desired to remove particular flood depths layers from the map for better visibility. By default, all flood depth levels are active. Clicking individual flood depth boxes in the color legend disables/enables the respective flood depth color in the map. Switch to Flood ExtentThe Flood Extent feature allows the user to visualize the entire extent of a flood rather than showing individual flood depth levels. If the Flood Extent checkbox is checked, flood data is shown in a uniform color irrespective of flood depth. Adjust OpacitySometimes it can be helpful to adjust the opacity of the flood visualization, for example to better identify buildings or topographic features. Slide the Opacity Slider to increase or decrease opacity. The map is updated in real time. My Layers
If Data Layers have been imported, the respective layers can be enabled/disabled in this section.
|
|