Running a Flood Analysis
|
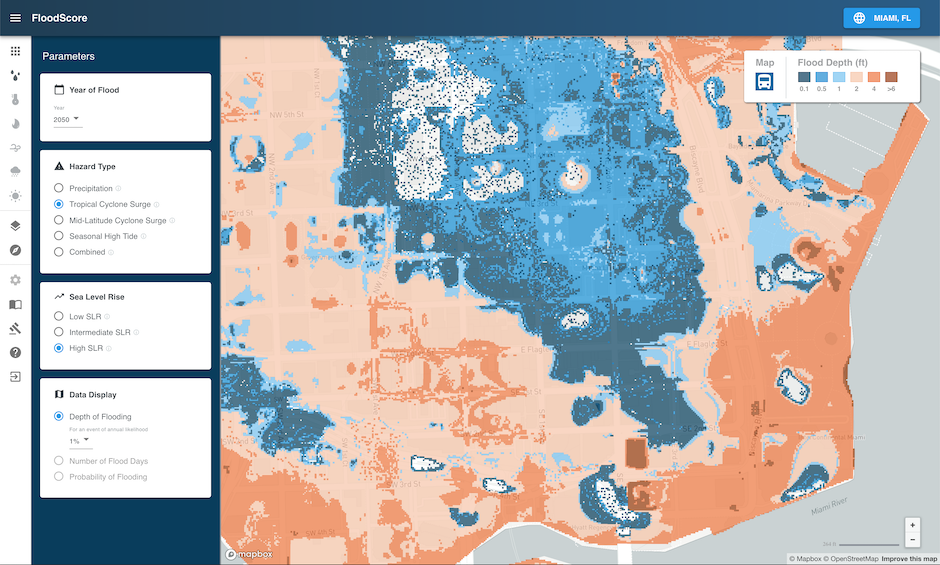
In order to run a flood probability analysis, select the geography of interest as well as enter the desired analysis parameters. The map shows flood visualization data according to the selections in the Parameters panel. It will also automatically update the displayed data every time one of the input parameters gets changed.
|
|||
1. Select geography for analysisClick on the Geo Selector and choose the area of interest. The map will automatically zoom in to the respective map section and the Geo Selector shows the selected area.
|
|||
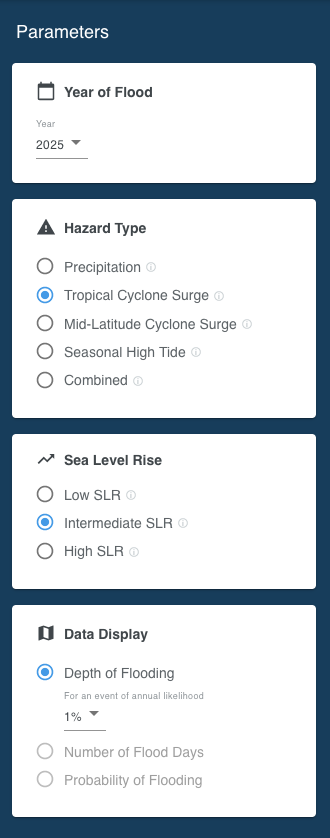
2. Select flood analysis parametersIn the Parameters panel adjust the following input parameters according to the desired risk analysis scenario. Find more information about the respective input parameters in the Flood Primer section. |
|||
Year of FloodThe point of time (year) in the future to run the analysis for. The dropdown list contains the available years specific to the selected area (geography). Hazard TypePrecipitationFlooding caused by heavy rainfall. Tropical Cyclone SurgeFlooding caused tropical wind system such as hurricanes or typhoons. Mid-Latitude Cyclone SurgeFlooding caused by storms that do not originate in the tropics (e.g. nor’easters) and other events that push water from the ocean onto the land. Coastal FloodingFlooding caused by storms that originate in the Hawaiian islands. Seasonal High TideFlooding caused by high tides that can lead to nuisance flooding. Colloquially these are sometimes called flooding from “King Tides” or “Sunny Day” flooding. CombinedStatistical combination of the probabilities of each hazard in the flood peril. Sea Level RiseSelect the sea level rise scenario of interest. The Low scenario assumes a rise of the Global Mean Sea Level (GMSL) of 0.3 meter by the year 2100, Intermediate assumes 1 meter GMSL rise and High a 2 or more meters GMSL rise by 2100. Find more information about the GMSL scenarios in the Sea Level Rise section. Data DisplayThe Depth of Flooding setting allows to adjust the annual probability of a flood event. 50% means that the flooding shown on the map has a 50% chance of happening at least once in the selected year. By adjusting the event probability, the map displays the flooding projection for the respective event likelihood. Learn more in the Event Probability section. Number of Flood Days is available in conjunction with Seasonal High Tide only. By adjusting the depth threshold, the map shows the number of days on which the set threshold will be exceeded.
|
|
||
3. Conduct spatial analysis to interpret risk |
|||
|
The map shows flood visualization data according to the selections in the Parameters panel. Various flood depth levels are indicated by different colors. The legend in the upper right shows the corresponding flood depth.
|
|
||
