How to run a data query
Select Locations |
|||||||||
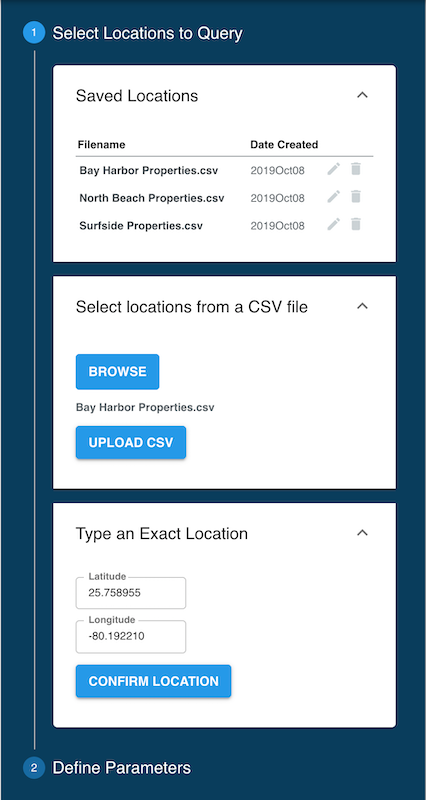
Enter single locationIn the Type an Exact Location card in the Query panel, enter the Latitude and Longitude coordinates of the point of interest in the respective fields and click the Confirm Location button
Running multiple pointsMore commonly, Data Explorer operations are performed for a series of geographical coordinates provided from one or more CSV files. Refer to CSV formats for samples of CSV file formats that can be used with Data Explorer. In the Select locations from a CSV file, click on the Browse button. When the file manager window opens, select the desired CSV file and click on the Upload CSV button. Repeat this operation for importing locations from multiple CSV files.
Using Saved LocationsWhen either individual coordinates or a CSV file is uploaded, the data is saved in the Saved Locations card in the Query panel. This function enables users to re-run any data that was already uploaded. Selecting one of the saved locations brings the respective file up to select hazard parameters. Saved Locations can be edited by clicking on the Pencil icon to the right, or deleted by clicking on the Trash Can icon. Uploaded CSV files are persistent across user sessions, they stay available in the Saved Locations section until they are manually deleted. |
|
||||||||
Analysis Parameters |
|||||||||
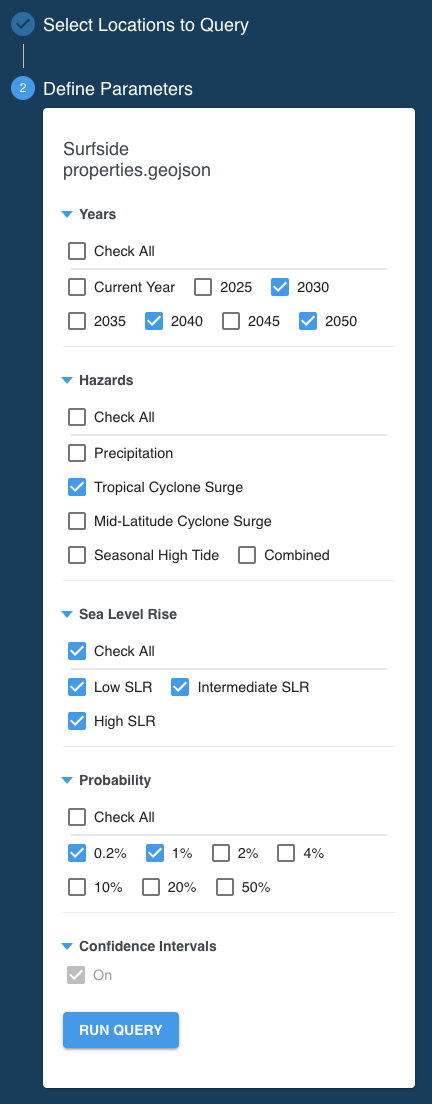
YearsThe point of time (year) in the future to run the analysis for. HazardsPrecipitationFlooding caused by heavy rainfall. Tropical Cyclone SurgeFlooding caused tropical wind system such as hurricanes or typhoons. Mid-Latitude Cyclone SurgeFlooding caused by storms that do not originate in the tropics (e.g. nor’easters) and other events that push water from the ocean onto the land. Seasonal High TideFlooding caused by high tides that can lead to nuisance flooding. Colloquially these are sometimes called flooding from “King Tides” or “Sunny Day” flooding. CombinedStatistical combination of the probabilities of each hazard in the flood peril. Sea Level RiseSelect the sea level rise scenario of interest. The Low scenario assumes a rise of the Global Mean Sea Level (GMSL) of 0.3 meter by the year 2100, Intermediate assumes 1 meter GMSL rise and High a 2 or more meters GMSL rise by 2100. Find more information about the GMSL scenarios in the Sea Level Rise section. ProbabilityThe annual probability of a flood event. Learn more in the Event Probability section. At least one item must be checked in each category. |
|
||||||||
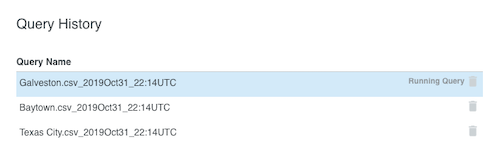
Run QueryWhen done with parameters click on the Run Query button. Queries against a large number of coordinates and/or many parameters set may takes some time. Smaller jobs may complete in less than a minute while a query of 10,000 points and all parameters enabled can take up to 45 minutes. A job status appears in the Query History card. The following statuses will occur during the query analysis:
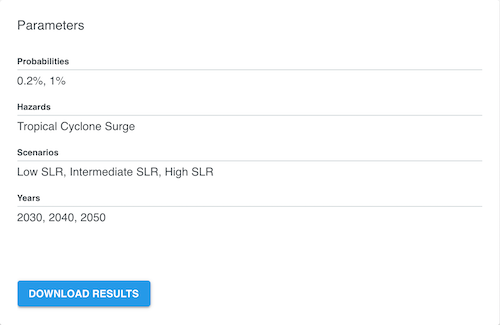
The Parameters card shows the analysis parameters of the highlighted query in the Query History card. If a query is selected (highlighted) which is showing "Analyzing", the Parameters card does not show any values until the highlighted query changes to "Running Query". After a job completes, the Download button in the Parameters card turns from gray to blue. |
|
||||||||

