CSV formats
Source CSV filesData Explorer accepts the CSV (comma-separated values) file format for uploading location data into the application. A single CSV file may contain up to 10,000 locations (latitude/longitude coordinate pairs), each line can contain only one latitude and one longitude value. Geographic coordinates must be expressed in decimal degrees, e.g.: 40.723296. Coordinates in the degree minutes seconds (DMS) format, e.g. 40° 43' 23.8656'' N, cannot be used with Data Explorer. Only the decimal point is accepted as decimal separator. Geographic coordinates are most commonly expressed in decimal numbers with six decimal degrees (digits to the right of the decimal point), e.g. 40.723296. An object the size of a human can be unambiguously identified at this precision. However, Data Explorer also accepts coordinates with fewer or more decimal degrees. There is no requirement or restriction on the number of decimal degrees.
|
||||
Header identificationThe header of the column that contains the LATITUDE values must be identified by any of the following denominations: latitude, LATITUDE, Latitude, lat, LAT, Lat, lati, LATI, Lati
The header of the column that contains the LONGITUDE values must be identified by any of the following denominations: longitude, LONGITUDE, Longitude, lon, LON, Lon, long, LONG, Long
|
||||
Source CSV sample |
|
|
||
|
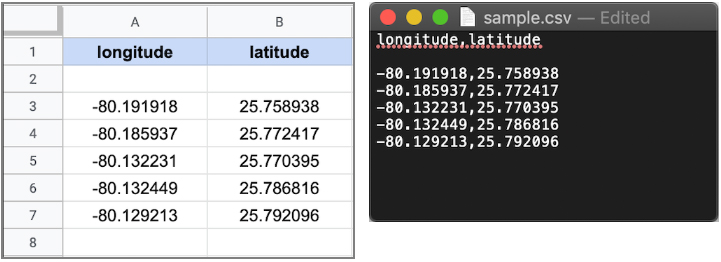
In the simplest case, a source CSV file contains only two columns: one for latitude values and one for longitude values. The order of the latitude/longitude columns within the CSV file is irrelevant. However, the columns must be properly identified by any one of the accepted header identification expressions. |
Sample CSV - spreadsheet and plain text view
|
|||
Results CSV fileThe results of an analysis can be downloaded as CSV file. It contains the input locations from the CSV source file as well as detailed analysis data for each of the provided locations. For a CSV source file that contained latitude/longitude values only, the corresponding results output file will look like the example below. The generated output file name is based on internal job encoding data, for instance 4b118ba8-7a5d-4bc9-8966-285e44b5796b.csv. It can be safely renamed to a more meaningful file name. Also, results files can grow up to 650 MB in size for an analysis of 10,000 coordinates with all parameters set.
|
||||
Columns descriptions:
Hazard Hazard type
Scenario Sea level rise scenario
Year Year of the flood projection
Period Return period
Latitude Latitude from CSV file (or user input)
Longitude Longitude from CSV file (or user input)
ModelLatitude Latitude of the selected grid point used to calculate hazard
ModelLongitude Longitude of the selected grid point used to calculate hazard
Elevation Digital ground elevation data used to calculate hazard
Probability Probability of annual occurrence
FloodDepth Projected water level at grid point
LowerBound Lower bound of the 95% confidence interval
UpperBound Upper bound of the 95% confidence interval
|
Results CSV example 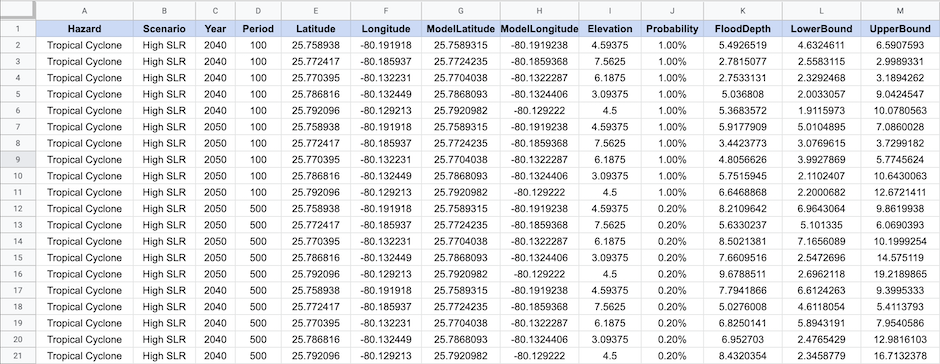
|
|||
CSV files containing additional data columns |
||||
|
Source CSV files which contain data columns other than geographical coordinates can also be used with Data Explorer. As long as the latitude/longitude values are properly indicated in the header, Data Explorer will extract the correct location data from the respective columns. |
Sample - table and text view 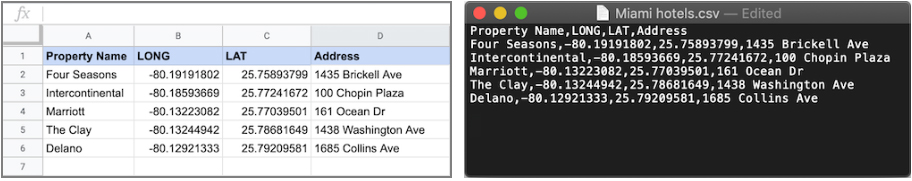
|
|||
|
Additional data columns from the source file are preserved and put back in the corresponding results output file. However, the order of the columns may change. When generating the results CSV file, the latitude/longitude columns are removed from the source column layout. The generated flood data columns, including the latitude and longitude columns, will be added to the right of the existing columns in the output file. For instance, a source CSV file with the column order Data X, Longitude, Latitude, Data Y will result in an output file of the following order: Data X, Data Y, Hazard, Scenario, Year, Period, Latitude, Longitude, ModelLatitude, ...
|
Results with additional columns 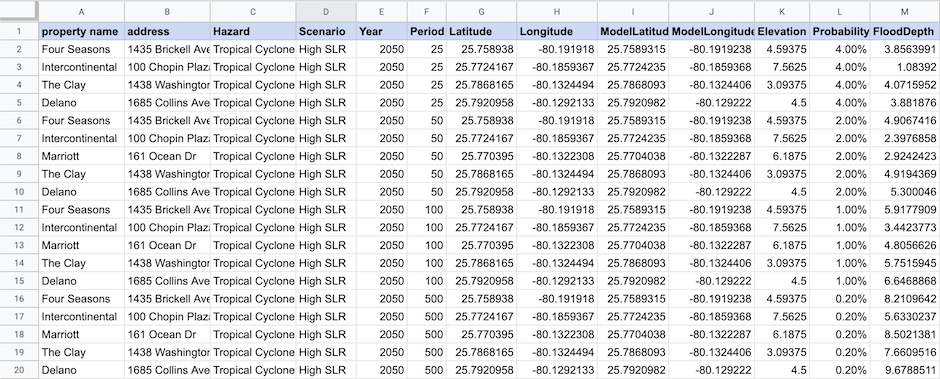
|
|||
